Bullion Brains Correlation Matrix

See when bullion is moving with the tape and when the relationship is breaking.

Matrix, rolling regimes, beta, diversification, and signals in one desk.

Map how gold, silver, crude, USDINR, and the rest of the commodity universe are moving together, then track when those relationships strengthen, fade, or diverge enough to matter.

Correlation desk
Bullion Brains correlation workspace showing matrix output, heatmap structure, rolling correlation, and signal depth

Real workspace capture showing matrix output, heatmap structure, rolling correlation, and the deeper beta-diversification-signal layer used for cross-asset decisions.

Trader Workflow

Map the relationship. Watch the regime. Act when the edge is real.

The correlation page is built as a working desk, not a one-number calculator. Traders can scan the asset web, judge whether the relationship is stable or changing, and then decide whether the move deserves hedge, sizing, or signal attention.

01

Build the asset set your desk is actually framing risk against

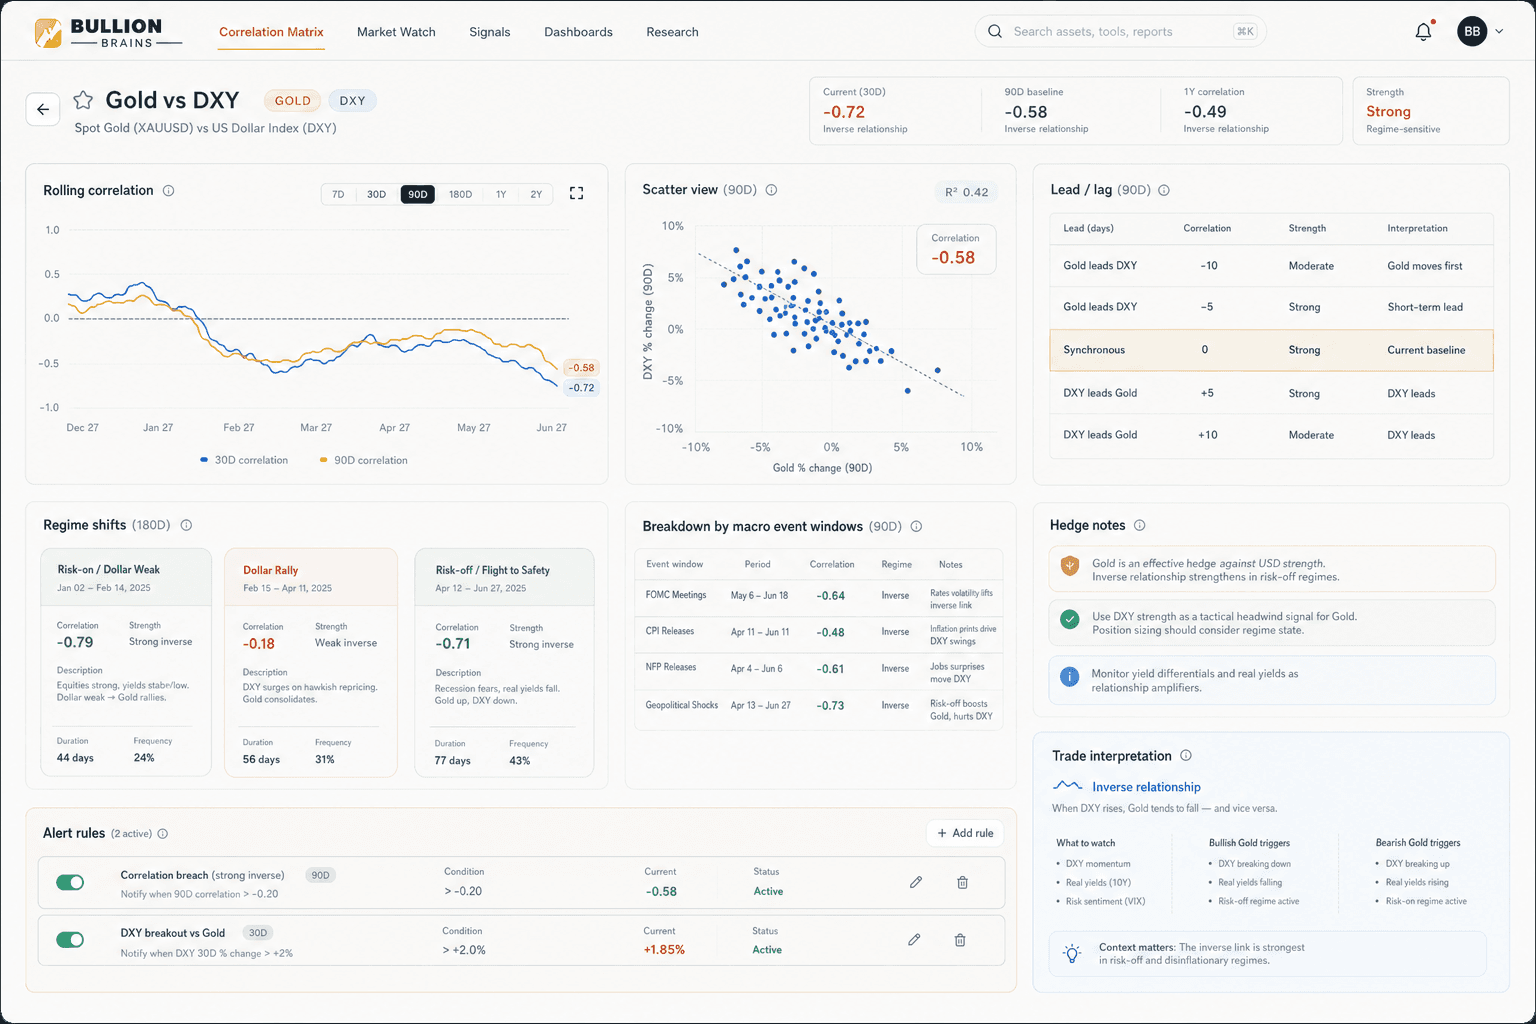
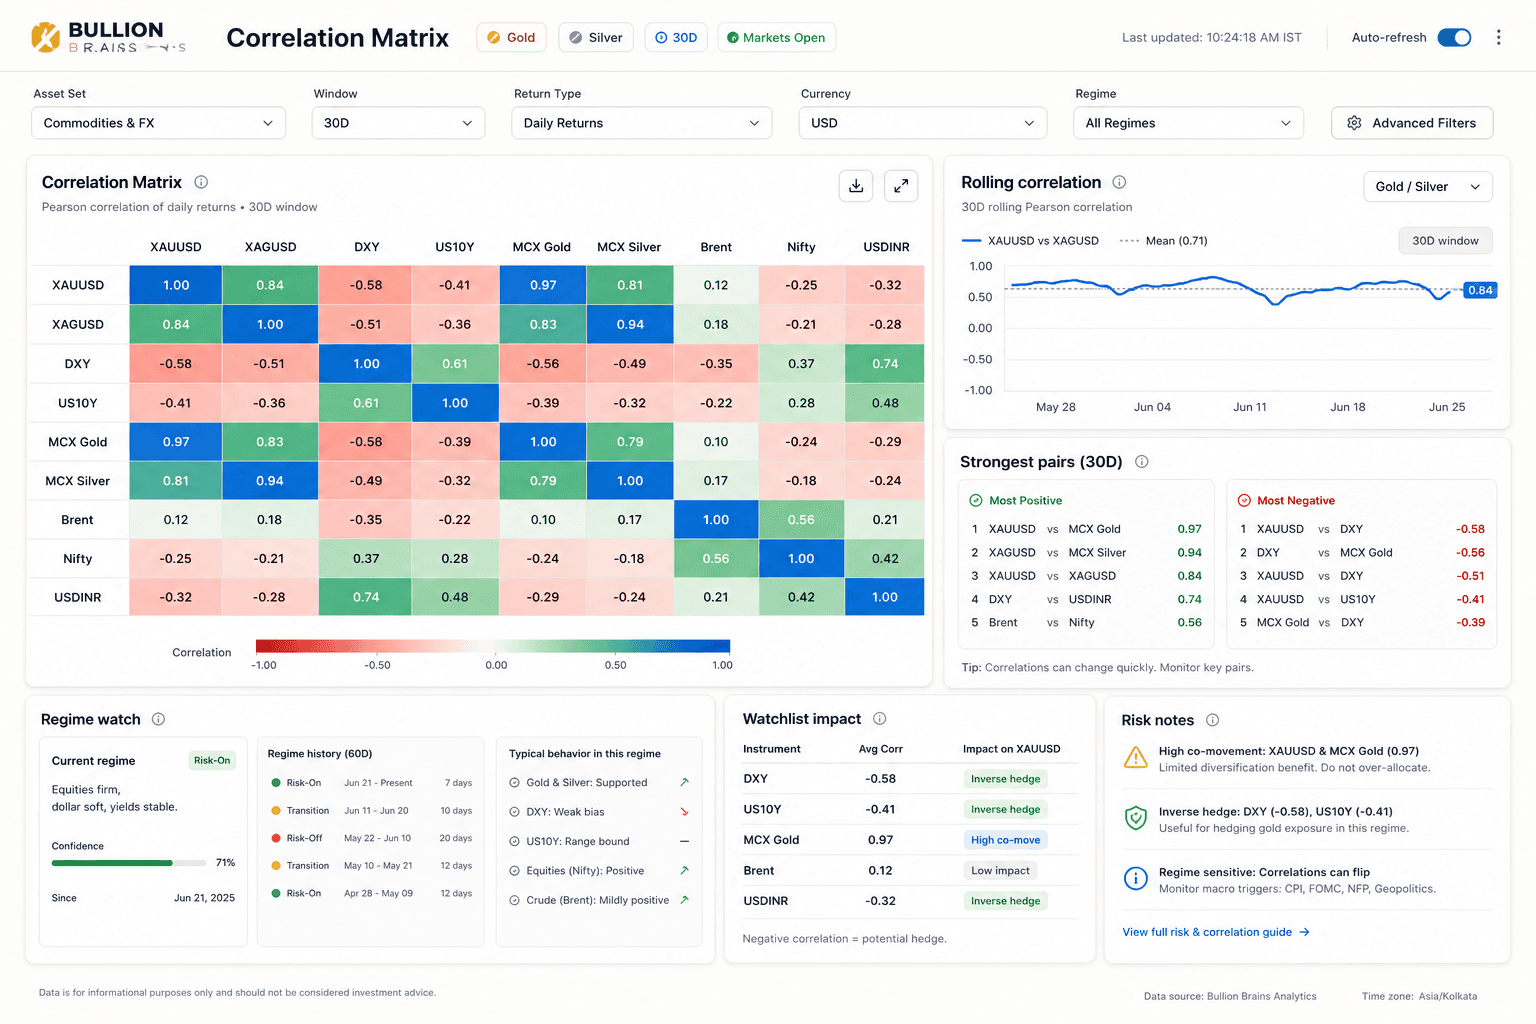
Start with the same matrix workflow the private tool uses: define the asset set, set the history window, and calculate the cross-asset relationship map across bullion, FX, and commodity markets.

  • Compare gold against silver, crude, USDINR, copper, platinum, palladium, and natural gas
  • Read pair-by-pair correlation, strength labels, p-values, and sample depth in one output surface
  • Use the heatmap to spot tight clusters, weak links, and negative relationships faster than a table scan
02

Watch the regime instead of assuming the relationship stays constant

Bullion Brains extends the matrix into rolling correlation and multi-period comparison so the desk can see whether the linkage is strengthening, weakening, or breaking down into a different regime.

  • Track 30-day rolling behavior across a longer historical sample to catch regime shifts early
  • Compare short-term and long-term readings before trusting a static average
  • Use range, extremes, and current-regime labels to see whether the relationship is stable enough to lean on
03

Translate the relationship into hedge, sizing, and trade logic

The deeper tabs turn correlation into decision support with beta, diversification scoring, divergence analysis, lead-lag behavior, and trading signals when the market moves out of line with expectation.

  • Use beta and scenario logic to estimate how fast one asset should move relative to another
  • Check diversification score before assuming the book is safer just because it has more tickers
  • Read divergence and lead-lag signals when the market is stretching away from its usual relationship
Regime depth
Bullion Brains correlation workspace showing regime depth, beta, diversification, and signal context

Correlation Desk Depth

A correlation tool only becomes useful when it tells the trader what to do with the relationship.

Bullion Brains turns cross-asset analytics into a desk-grade layer for commodity traders. The point is not just to label a pair as positive or negative. The point is to show whether the relationship is tradable, stable, diversifying, or breaking down into a signal.

Heatmap and matrix

See the full cross-asset map, not just one pair, so clusters and outliers stand out immediately.

Rolling regimes

Track how correlation is changing over time so the desk can tell a living regime apart from an outdated average.

Beta and diversification

Use sensitivity and portfolio-mix context before assuming a hedge or basket is actually reducing risk.

Signals and divergence

Read lead-lag, divergence, and mean-reversion style signals when the relationship departs from what the desk expects.

Connected Workflow

Correlation is strongest when it sits beside pricing, timing, and execution research.

Cross-asset context is a conviction layer. Bullion Brains lets traders move from relationship analysis into local pricing dislocation, strategy validation, and the platform workflow they use when the edge becomes part of the routine.

  • Cross-check fair value when local bullion is moving with or against the wider cross-asset relationship
  • Push strong relationship ideas into the backtester when the setup needs rules instead of narrative
  • Move into the right platform plan when rolling regimes and signal tabs become part of the daily desk

Cross-Asset Edge

Start with the market web, then decide whether the move deserves conviction.

Open the Bullion Brains correlation desk, read the regime, and act only when the relationship holds up under real trader scrutiny.

Gold Correlation Matrix | Rolling Correlation, Beta, Diversification & Cross-Asset Signals