
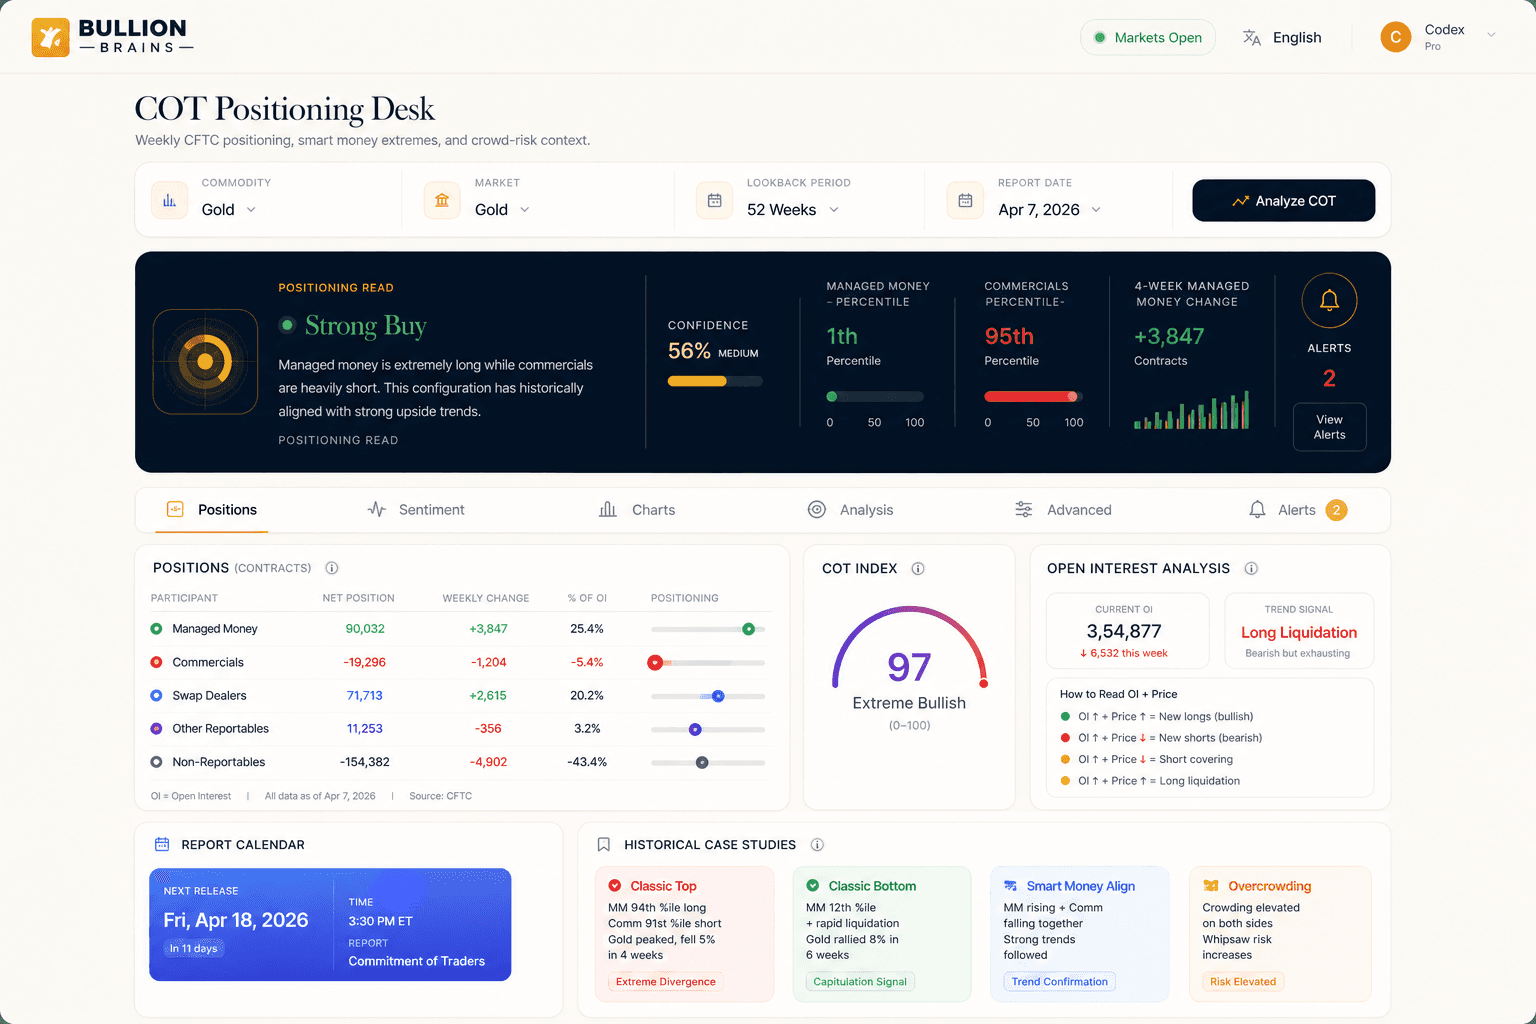
Select the commodity and the historical window your desk is actually using
The live tool starts with commodity and lookback controls so you can compare the current gold or silver positioning state against the right historical sample.
Bullion Brains COT Analysis
Hedgers, speculators, crowding, and squeeze risk in one bullion workflow.
Turn weekly CFTC Commitment of Traders and gold COT report data into a working desk read for gold, silver, crude, copper, and natural gas. Bullion Brains organizes participant positioning, percentile context, COT Index, open-interest signals, alerts, and advanced regime analysis in one surface.
Sign-in opens the full COT dashboard with premium charts, advanced analytics, and alert workflows tied to your subscription tier.

Trader Workflow
A gold COT report matters when it moves from a raw Friday table into a repeatable decision process. The Bullion Brains workflow is built to show who is leaning, how stretched the positioning is, and whether the setup deserves real attention.
The live tool starts with commodity and lookback controls so you can compare the current gold or silver positioning state against the right historical sample.
Bullion Brains organizes Managed Money, Commercials, Swap Dealers, and Other Reportables into clearer positions, sentiment gauges, and signal-ready summaries.
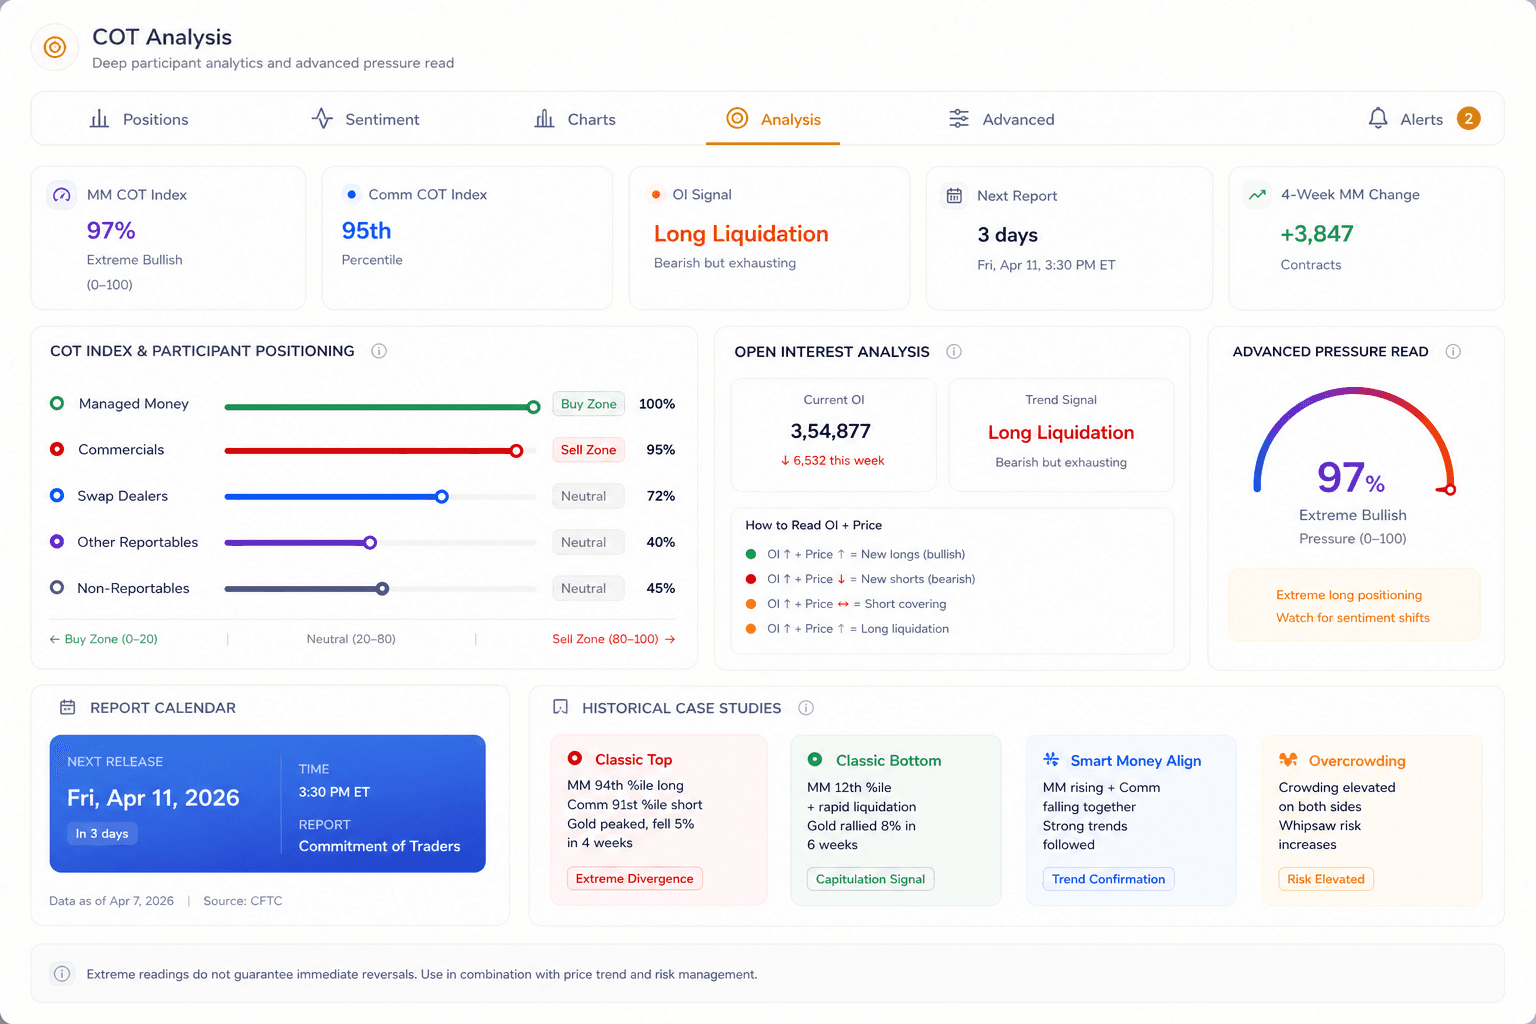
The deeper analysis layer turns positioning into decision support with regime context, crowding, squeeze metrics, and alert conditions.
Desk Depth
The point is not to memorize categories. The point is to understand where the market is crowded, which side looks exhausted, when open interest confirms the move, and how weekly positioning fits into a broader commodity research routine.

Read hedgers, managed money, swaps, and other reportables side by side instead of treating COT like one speculator number.
Normalize the current positioning against history so crowding and extremes stand out faster than they do in raw contract counts.
Separate new longs, new shorts, short covering, and long liquidation before you over-interpret a weekly change.
Use crowding, squeeze risk, and regime summaries to understand when a positioning extreme is fragile enough to matter.
Connected Workflow
COT is strongest as a conviction layer. Bullion Brains lets traders move from positioning into basis, macro releases, and the platform access they need for the full commodity routine.
Search questions
These are the checks traders usually need before opening the weekly CFTC table, a spreadsheet, or a positioning dashboard.
A COT report is the CFTC Commitment of Traders report. It shows how different futures-market participant groups are positioned, including commercial hedgers, managed money, swap dealers, and other reportables. Commodity traders use it to understand positioning pressure, crowding, and whether a move is backed by fresh participation or vulnerable to squeeze and liquidation.
Gold traders compare managed money, commercials, open interest, COT Index percentiles, and recent positioning changes. The goal is to see whether the gold market is building conviction, becoming crowded, or setting up for a contrarian move that needs confirmation from price, macro timing, pivots, and fair value.
The COT Index normalizes current positioning against its historical range. A high or low reading can reveal positioning extremes faster than raw contract counts, but traders should still combine it with open-interest behavior, price action, and upcoming macro catalysts.
No. COT analysis is a positioning and conviction layer, not a standalone entry signal. Bullion Brains uses COT with fair value, macro calendar context, pivots, liquidity, and risk controls before treating a setup as actionable.
Positioning Edge
Open the Bullion Brains COT workflow, see who is crowded, who is hedging, and whether the setup deserves conviction before the next move unfolds.