
Bullion Brains Seasonal Trends

Study gold market seasonality with evidence, not folklore.

Monthly bias, event studies, heatmaps, and strategy handoff in one desk.

Study gold market seasonality and the seasonality of gold across gold, silver, platinum, and palladium with year-depth controls, event windows, calendar heatmaps, and trader-ready strategy templates built for timing rather than storytelling.

Seasonal research desk
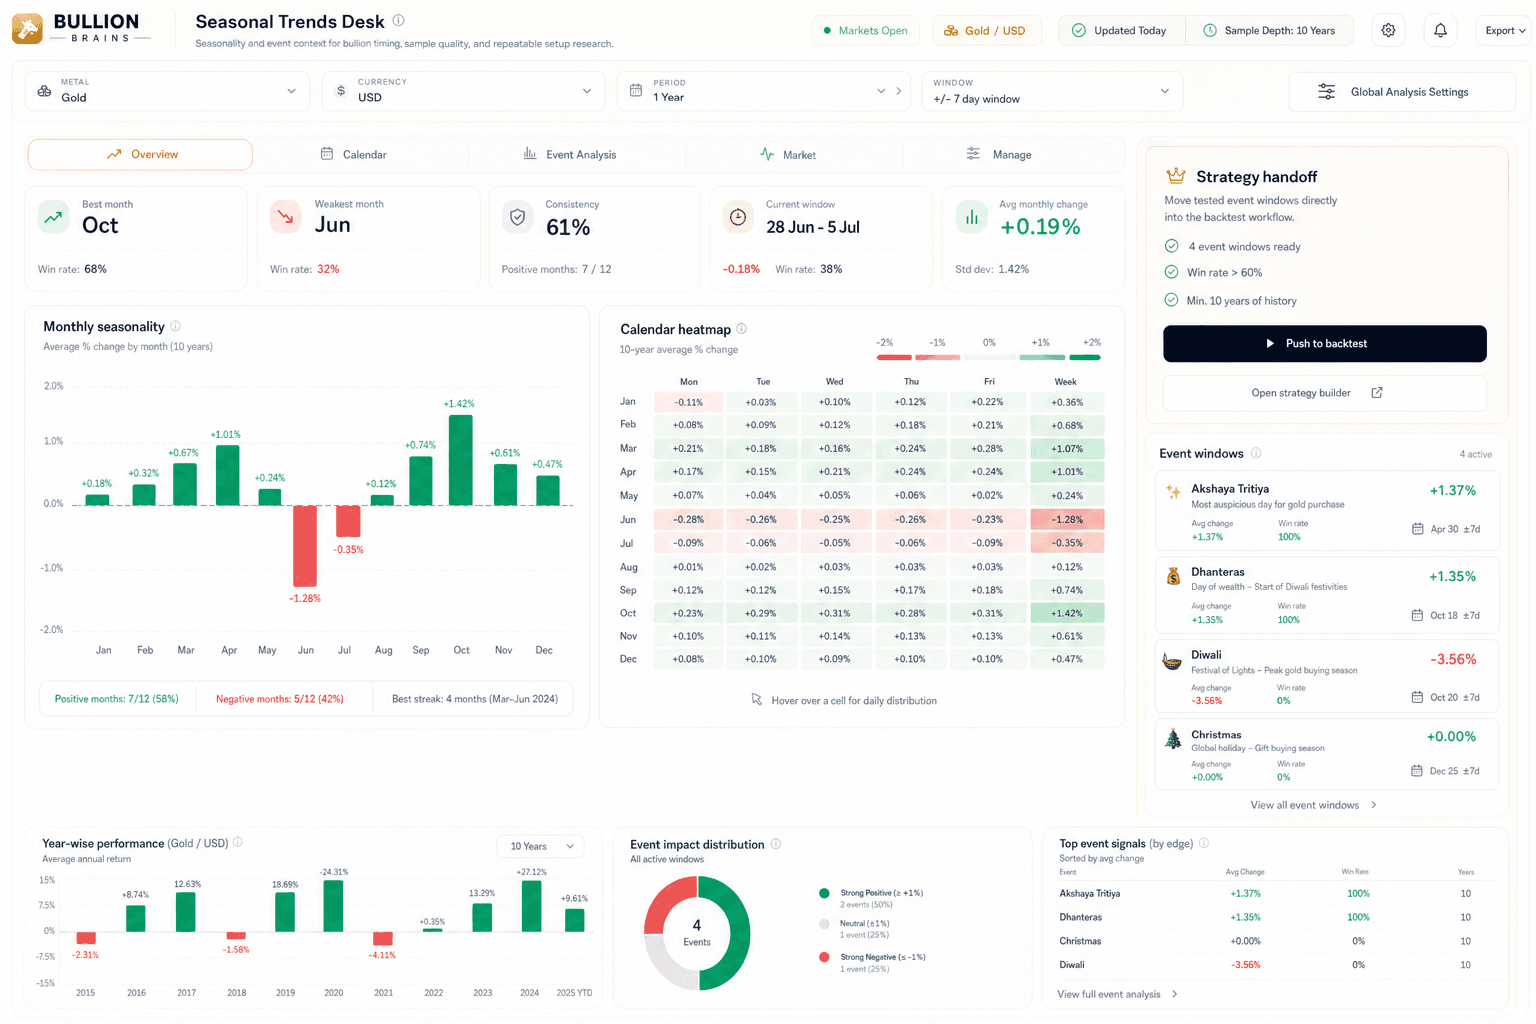
Bullion Brains seasonal workspace showing strategy templates, monthly studies, heatmaps, and timing workflow

Real seasonal workspace capture showing strategy templates, monthly studies, heatmaps, and the broader timing workflow traders use before execution.

Event timing depth
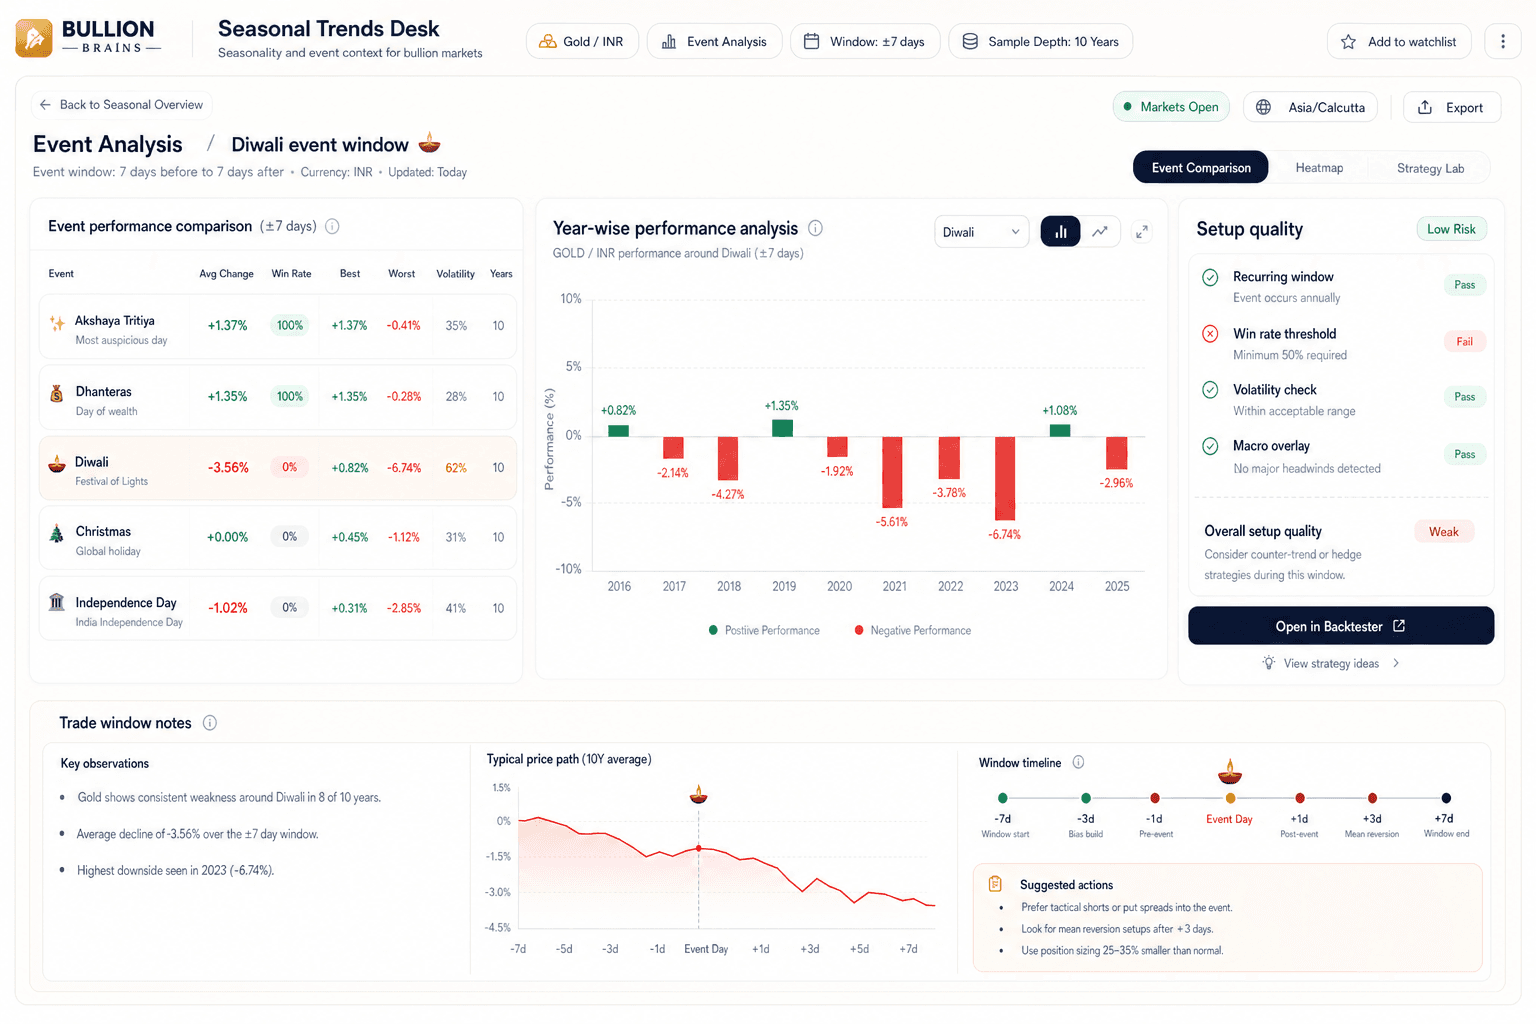
Bullion Brains seasonal workspace showing event timing depth, calendar heatmaps, and study detail

Trader Workflow

Choose the seasonality-of-gold window. Read the edge. Push it into execution.

The seasonal page is designed like a research desk, not a decorative chart gallery. It helps traders define the market window they care about, inspect repeatable behavior, then move the idea toward execution when the edge survives scrutiny.

01

Choose the market window your desk actually trades

Start with the same controls the private tool uses every day: metal, currency, years of history, and event-window sizing around the seasonal behavior you want to test.

Switch between GOLD, SILVER, PLATINUM, and PALLADIUM
Frame the analysis in local currency or USD depending on the desk context
Move from 1 month to 15 years of history and tighten the event window from ±3 to ±30 sessions
02

Read the recurring edge before you trust the narrative

Bullion Brains turns gold market seasonality into a working decision surface with monthly studies, event impact charts, calendar heatmaps, and advanced trajectory views that reveal what usually happens around the window.

Use monthly seasonality to see strongest and weakest periods instead of relying on memory
Check event studies and calendar heatmaps for how the path typically behaves around festival or macro windows
Layer in market overlays and recession-aware context when the pattern needs broader confirmation
03

Push the idea toward execution only when it still looks real

The seasonal desk includes strategy templates, verified event management, upcoming alerts, and a direct handoff into the backtester when the timing window deserves a rules-based test.

Load holiday demand, seasonal demand window, policy window, or other strategy templates to shortcut research
Manage verified events, notes, and average impact without leaving the same workflow
Send the setup into the backtester when you want to convert seasonal narrative into repeatable rules

Seasonal Desk Depth

The edge is not the chart. The edge is the stack around the chart.

Seasonal timing only becomes useful when traders can see where the pattern comes from, how often it held up, whether an event window is verified, and what the next step should be. Bullion Brains turns that entire chain into one calmer workspace.

Gold market seasonality

Read average return, consistency, best months, worst months, and related gold stock seasonality context without confusing commodity timing with mining equity data.

Calendar heatmap

Inspect daily seasonal tendencies across the year so the desk can see whether a timing window is broad, narrow, or fading.

Event studies and alerts

Track recurring festival and macro windows with event-level paths, notes, impact context, and upcoming alert visibility.

Backtest handoff

When the seasonal idea survives scrutiny, move it toward rules-based validation instead of leaving it as a research note.

Connected Workflow

Seasonality matters most when it sits inside the rest of the commodity routine.

Seasonal timing is a conviction layer, not a standalone prediction engine. Bullion Brains lets traders move from recurring behavior into macro timing, backtesting, and the platform workflow they use every week.

Check the economic calendar when a macro release could amplify or cancel the seasonal window
Hand the setup to the backtester when the idea needs objective rules before real sizing
Move into the platform plan that supports deeper history, verified events, and daily seasonal preparation

Search questions

Answers for gold & local market seasonality searches

The checks traders usually run before they read a monthly seasonality chart for local market gold, local market silver, or a COMEX contract and frame the months ahead.

What is gold seasonality and how is it measured?

Gold seasonality is the tendency for gold prices to show recurring patterns at the same time each year. It is measured by averaging each calendar month's price change across many years of history and pairing that average return with a win rate — the share of years in which that month was positive. Bullion Brains seasonal analysis computes both the monthly average-return curve and the win rate for local market gold, local market silver, and COMEX contracts so a pattern is read as a statistic, not a hunch.

Is there a seasonal pattern in gold prices?

Historically, yes — gold has shown a recognisable calendar rhythm. Across multi-year samples, late summer through the fourth quarter has more often been firm while parts of the second quarter have been softer, though the strength of the pattern varies by year and by market. For local market gold the seasonal curve also carries a FX overlay, because the contract is priced in local currency, so local seasonality can differ from the COMEX gold pattern in the same month.

Which months are historically strongest for gold in global markets?

In global markets the historically firm stretch has clustered around the August–October festival run into holiday demand plus the wedding-buying season, when physical demand rises. Bullion Brains shows the exact best- and weakest-month ranking with each month's average return and win rate over the sample, rather than a single rule of thumb, because the ranking shifts as you change the lookback window and the contract.

How do holiday demand, seasonal demand window, and wedding season affect gold seasonality in global markets?

Festival and wedding demand is the global markets-specific layer that generic global seasonality charts miss. seasonal demand window (around April–May) and the Dussehra–holiday demand window (around October–November), followed by the wedding season, are traditional gold-buying peaks that can lift physical demand and colour the local market seasonal pattern. Bullion Brains runs event studies around these dates so you can see how local market gold behaved in the days around each festival across past years.

Does seasonality analysis work for silver and other local market commodities?

Yes. The same monthly average-return and win-rate framework applies to local market silver, crude oil, copper, and natural gas, and several of these carry stronger calendar effects than gold — energy contracts in particular have well-documented demand-driven seasonality. Bullion Brains keeps the workflow identical across contracts so the seasonal read is consistent whether you study local market silver or COMEX gold.

Is gold seasonality reliable enough to trade on its own?

No. Seasonality is a context and probability layer, not a standalone entry signal, and past seasonal averages do not guarantee future returns. A firm month can still fall if the macro backdrop shifts. Bullion Brains treats seasonality as where to expect a tailwind or headwind, then confirms with the strategy backtester, the economic calendar, and risk controls before a pattern informs any decision.

Timing Edge

Start with repeatable windows, then test whether they deserve capital.

Open the Bullion Brains seasonal desk, study the recurring behavior, and carry only the strongest timing ideas forward into execution.